commit 6f817ea39cee879a6022c5debc3c22eceadbec02
Author: dchakro <35454738+dchakro@users.noreply.github.com>
Date:   Tue Aug 25 16:05:09 2020 +0300

    Updates

commit 7b789a0ea89c057e4bc3e205198b3374c7d3d312
Author: dchakro <35454738+dchakro@users.noreply.github.com>
Date:   Tue Aug 25 16:02:58 2020 +0300

    add support for font face.

    bold, italic, bold-italic and plain.
|
||
|---|---|---|
| img | ||
| DC_theme_generator.R | ||
| LICENSE | ||
| README.md | ||
| source.R | ||
| theme_dc.plot.L.45.nolegend.R | ||
DC_theme_generator : a theme generator for ggplot2
ggplot2 is a fantastic package made available by the great people over at tidyverse. ggplot2 is great for designing plots layer by layer in R. Although ggplot2 provides theming capabilities, the default choices available through the package can seem mundane and unapplealing for making publication quality figures.
See these examples:

I found myself writing these ggplot2::theme() objects everytime I wanted to plot something. So I wrote an R function that allows me to customize some key aspects of ggplot2::theme() and have a bit more granular control over the aesthetics of the "canvas" of my plots so to speak.
DC_theme_generator has handpicked defaults that make a plot look beautiful right out of the box.
Using DC_theme_generator
source("https://gitlab.utu.fi/deecha/ggplot_themes/-/raw/master/DC_theme_generator.R")

customtheme <- DC_theme_generator(type='L')
ggplot()+geom_point()+customtheme
More detailed usage instructions along with an example can be found in the R script source.R in this repo.
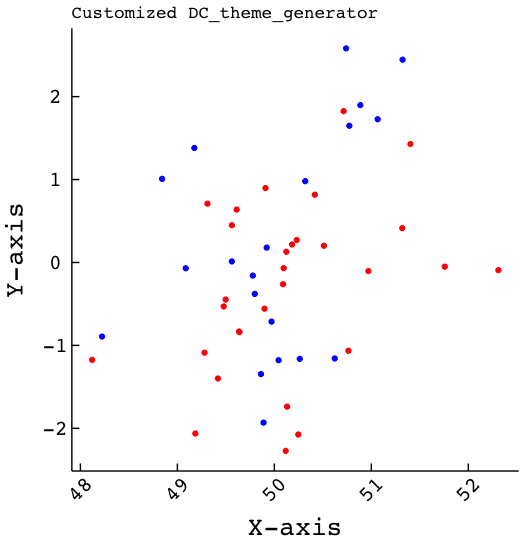
Here is an example tweaking some of the defaults:
source("https://gitlab.utu.fi/deecha/ggplot_themes/-/raw/master/DC_theme_generator.R")
customtheme <- DC_theme_generator(type = 'L',
                                  legend = 'F',
                                  ticks = 'out',
                                  x.axis.angle = 45,
                                  hjust = 0.5,
                                  vjust = 0.5,
                                  fontsize.cex = 1.8,
                                  fontfamily = 'mono')

ggplot(data = dat, aes(x=X, y=Y, color=Class)) + geom_point() + scale_color_manual(values=c("red","blue")) + xlab("X-axis") + ylab("Y-axis") + ggtitle("Customized DC_theme_generator") + customtheme
The above theme results in a canvas like this: